Generate a visual representation of your data set. This could be a chart, graph, or diagram, provided as an image output.
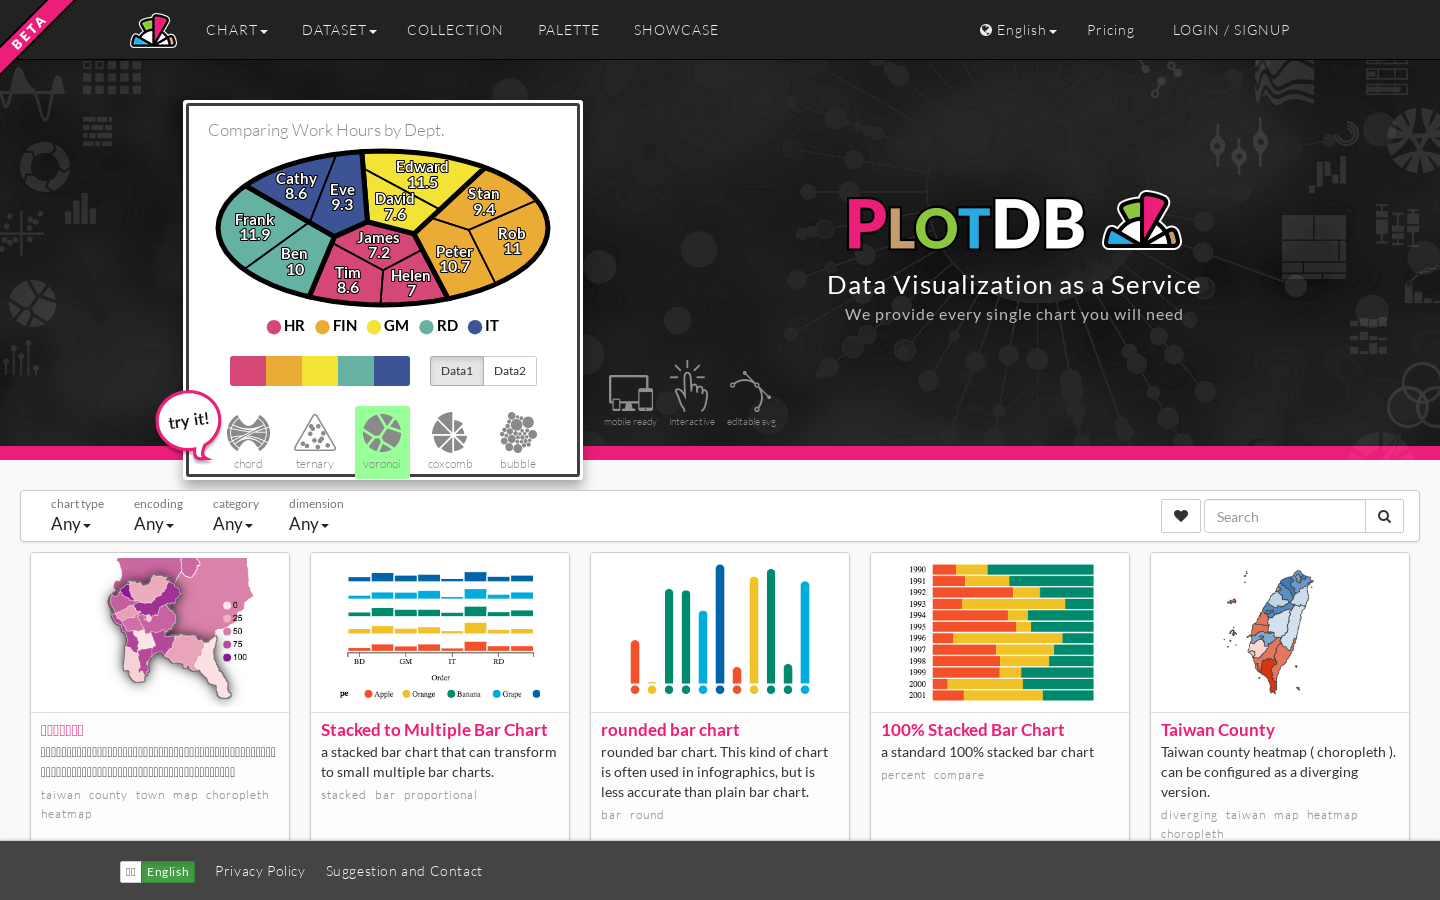
PlotDB is an online service that allows you to create data visualizations. With both free and paid plans available, you can easily share your visualizations with everyone. Simply visit the website, sign in using social auth or Google sign in, and start creating stunning visualizations from scratch. You can also manage your datasets and collections, and explore other visualizations shared by the community. With around 10,000 monthly visits, PlotDB is a popular choice for data visualization needs.
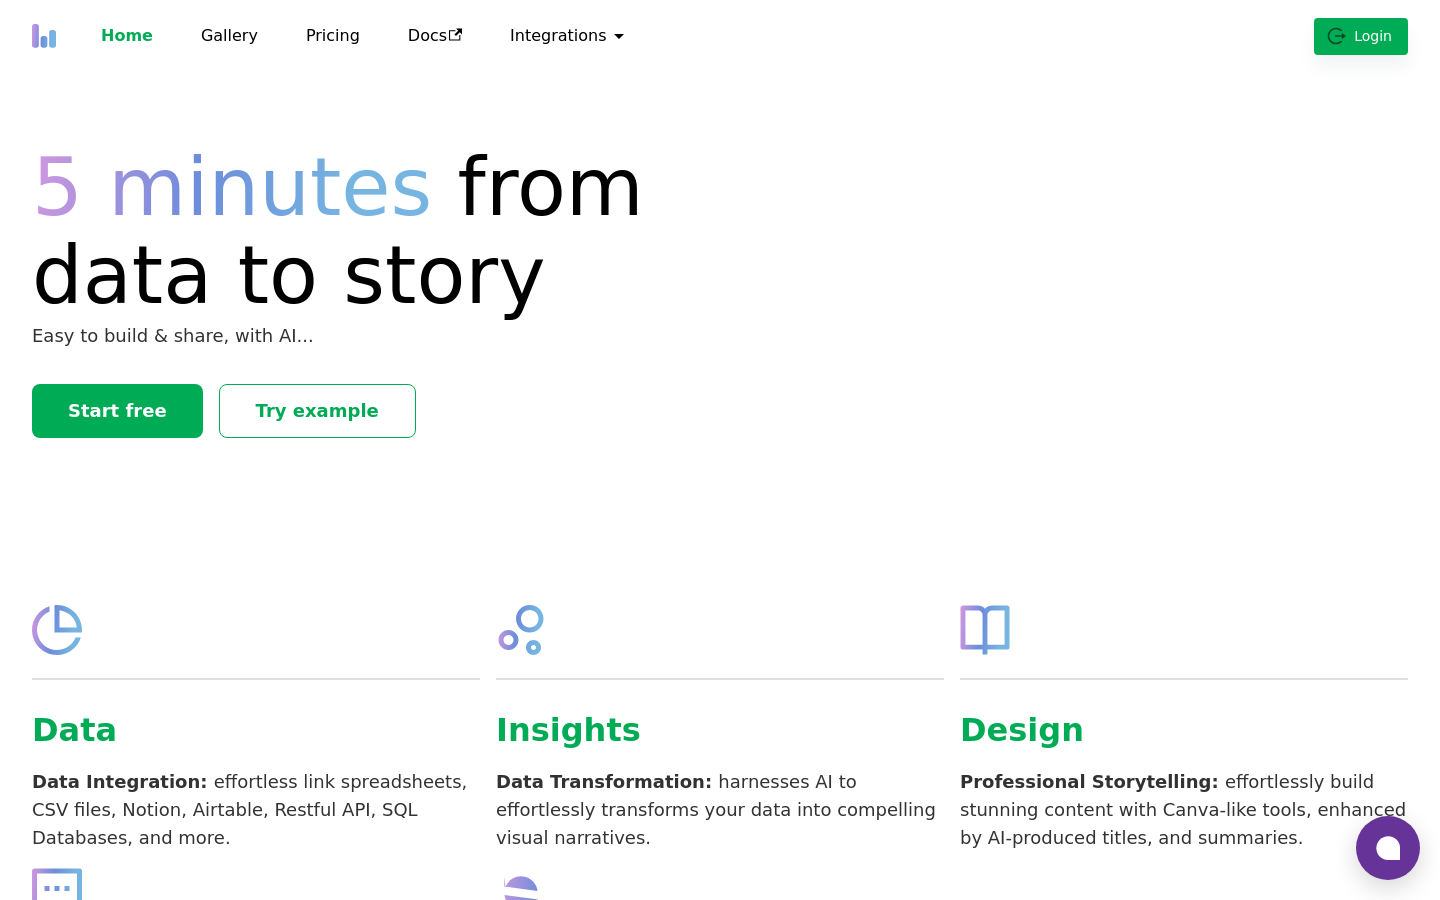
Columns is the fastest data visualization platform where teams can create data visualizations and generate insight summaries. With fine-grained access control and self-serve data storytelling, collaborate with your team and manage your data catalog with ease. Available plans include free and paid options. Access the service through the website. Obstacles when using the service include social auth, Google sign in, email required, and account registration required. Visit the website for more information.